Edit report display options
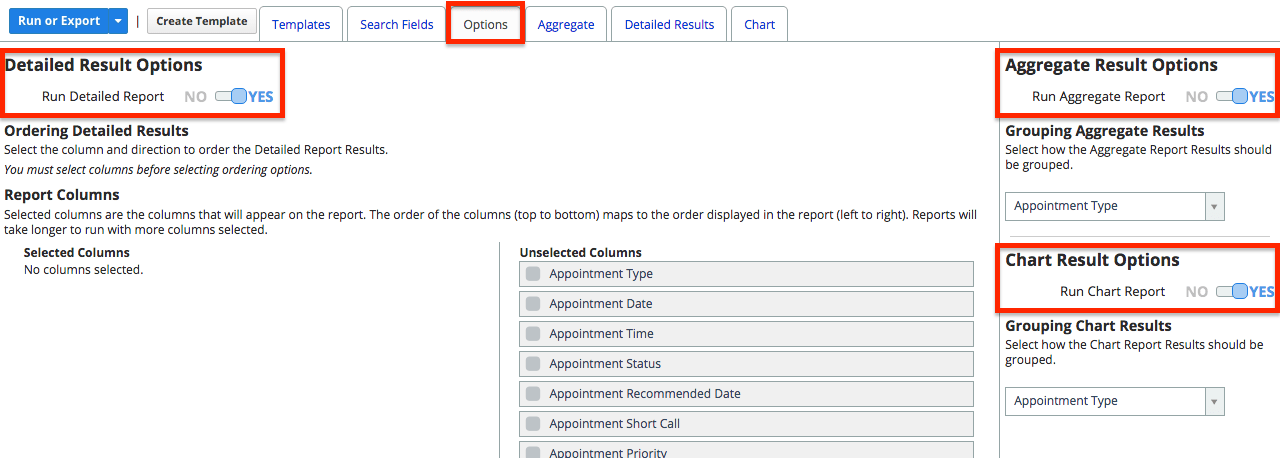
The way that report results are displayed and organized can be adjusted from the Options tab in Reporting. The Options tab is organized into three sections. These sections represent the three ways that report results can be viewed.
Changes made here can be saved if you're working with one of your own report templates. If you're working with a shared template, you can create a copy of the report template that includes your changes.
If you only want to adjust the way results are displayed once, you can select Run or Export to see your changes without affecting any report templates.
Select result types to display
You can decide whether all three types of results will be displayed when a report is run. If your report doesn't benefit from displaying results as a Chart, it can be disabled for that report.
- Select the Options tab
- Toggle Yes or No for each of the report result types
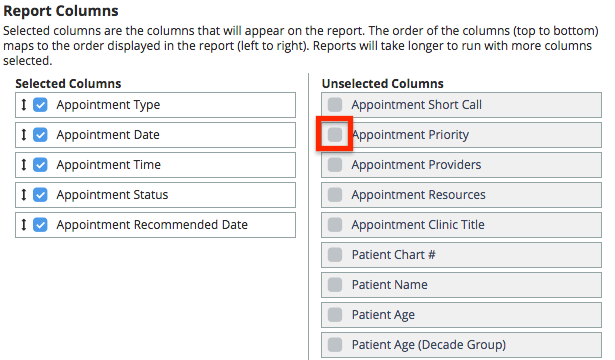
Customize detailed result options
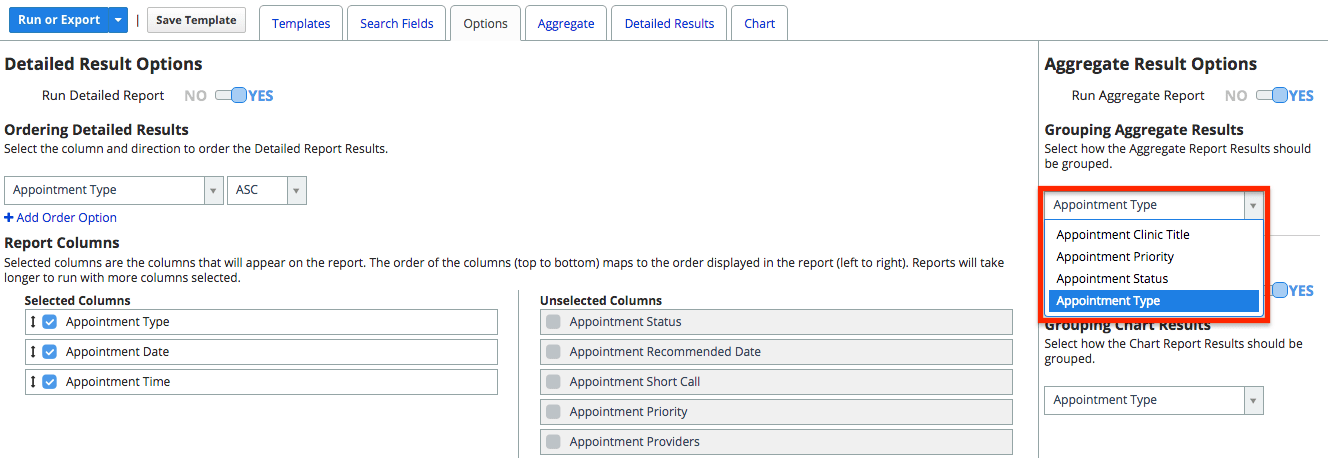
You can select the columns you want to display in the detailed results view and set how the results will be ordered. You must select columns before selecting ordering options.
- Select the check-box of any columns you want to display
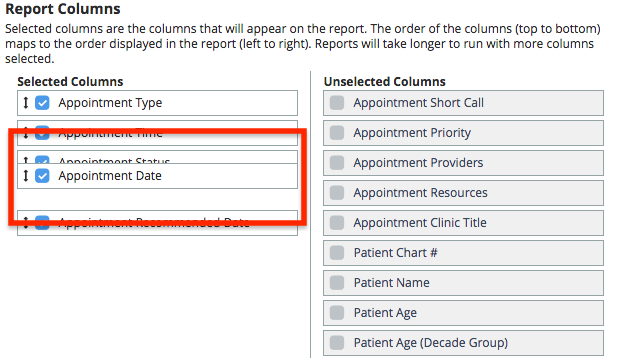
- Drag and drop any of the selected columns to change their order
Once you've selected your columns you can decide how you want to order the results.
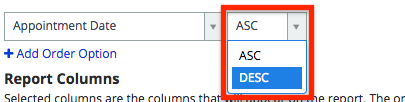
- Select a column type from the Ordering Detailed Results drop-down menu
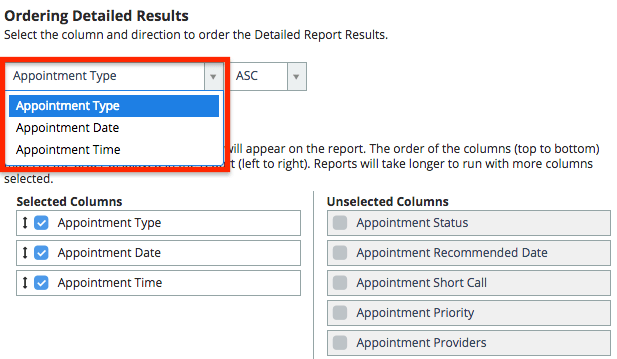
- Confirm whether you want results to appear in ascending or descending order
- Optional: Select + Add Order Option to define more
- After you make your adjustments you have the following options.
- To run the report with your new settings, select Run or Export
- To create your own copy of a shared report template with these changes, select Copy Template
- To update your personal report template with these changes, select Save Template
Customize aggregate & chart result options
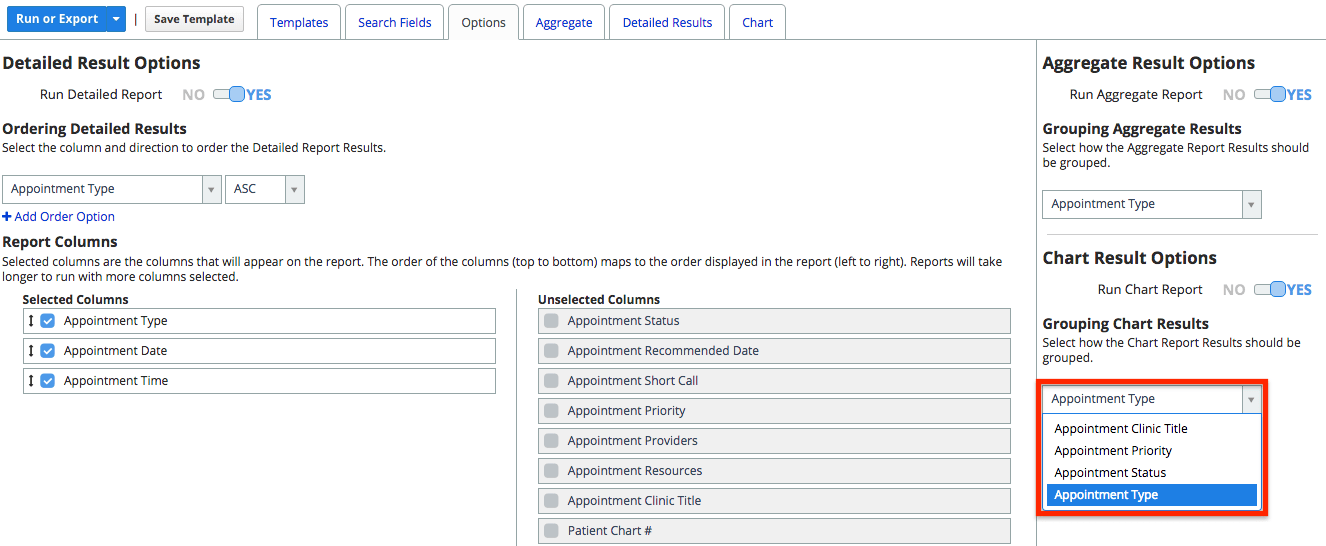
You can decide how the aggregate and chart results will be grouped. The available grouping options depend on the report type.
- Select a variable from the Grouping Aggregate Results drop-down menu
- Select a variable from the Grouping Chart Results drop-down menu
- After you make your adjustments you have the following options.
- To run the report with your new settings, select Run or Export
- To create your own copy of a shared report template with these changes, select Duplicate Template
- To update your personal report template with these changes, select Save Template
Customize cache options
After a report is run for the first time, the system uses cached results if the exact same report is run again within the Cache Time Limit.
You can define how long the system will retain a cache for a specific report template from the last time the report was run.
- Select the Options tab
- Scroll down to Cache Options
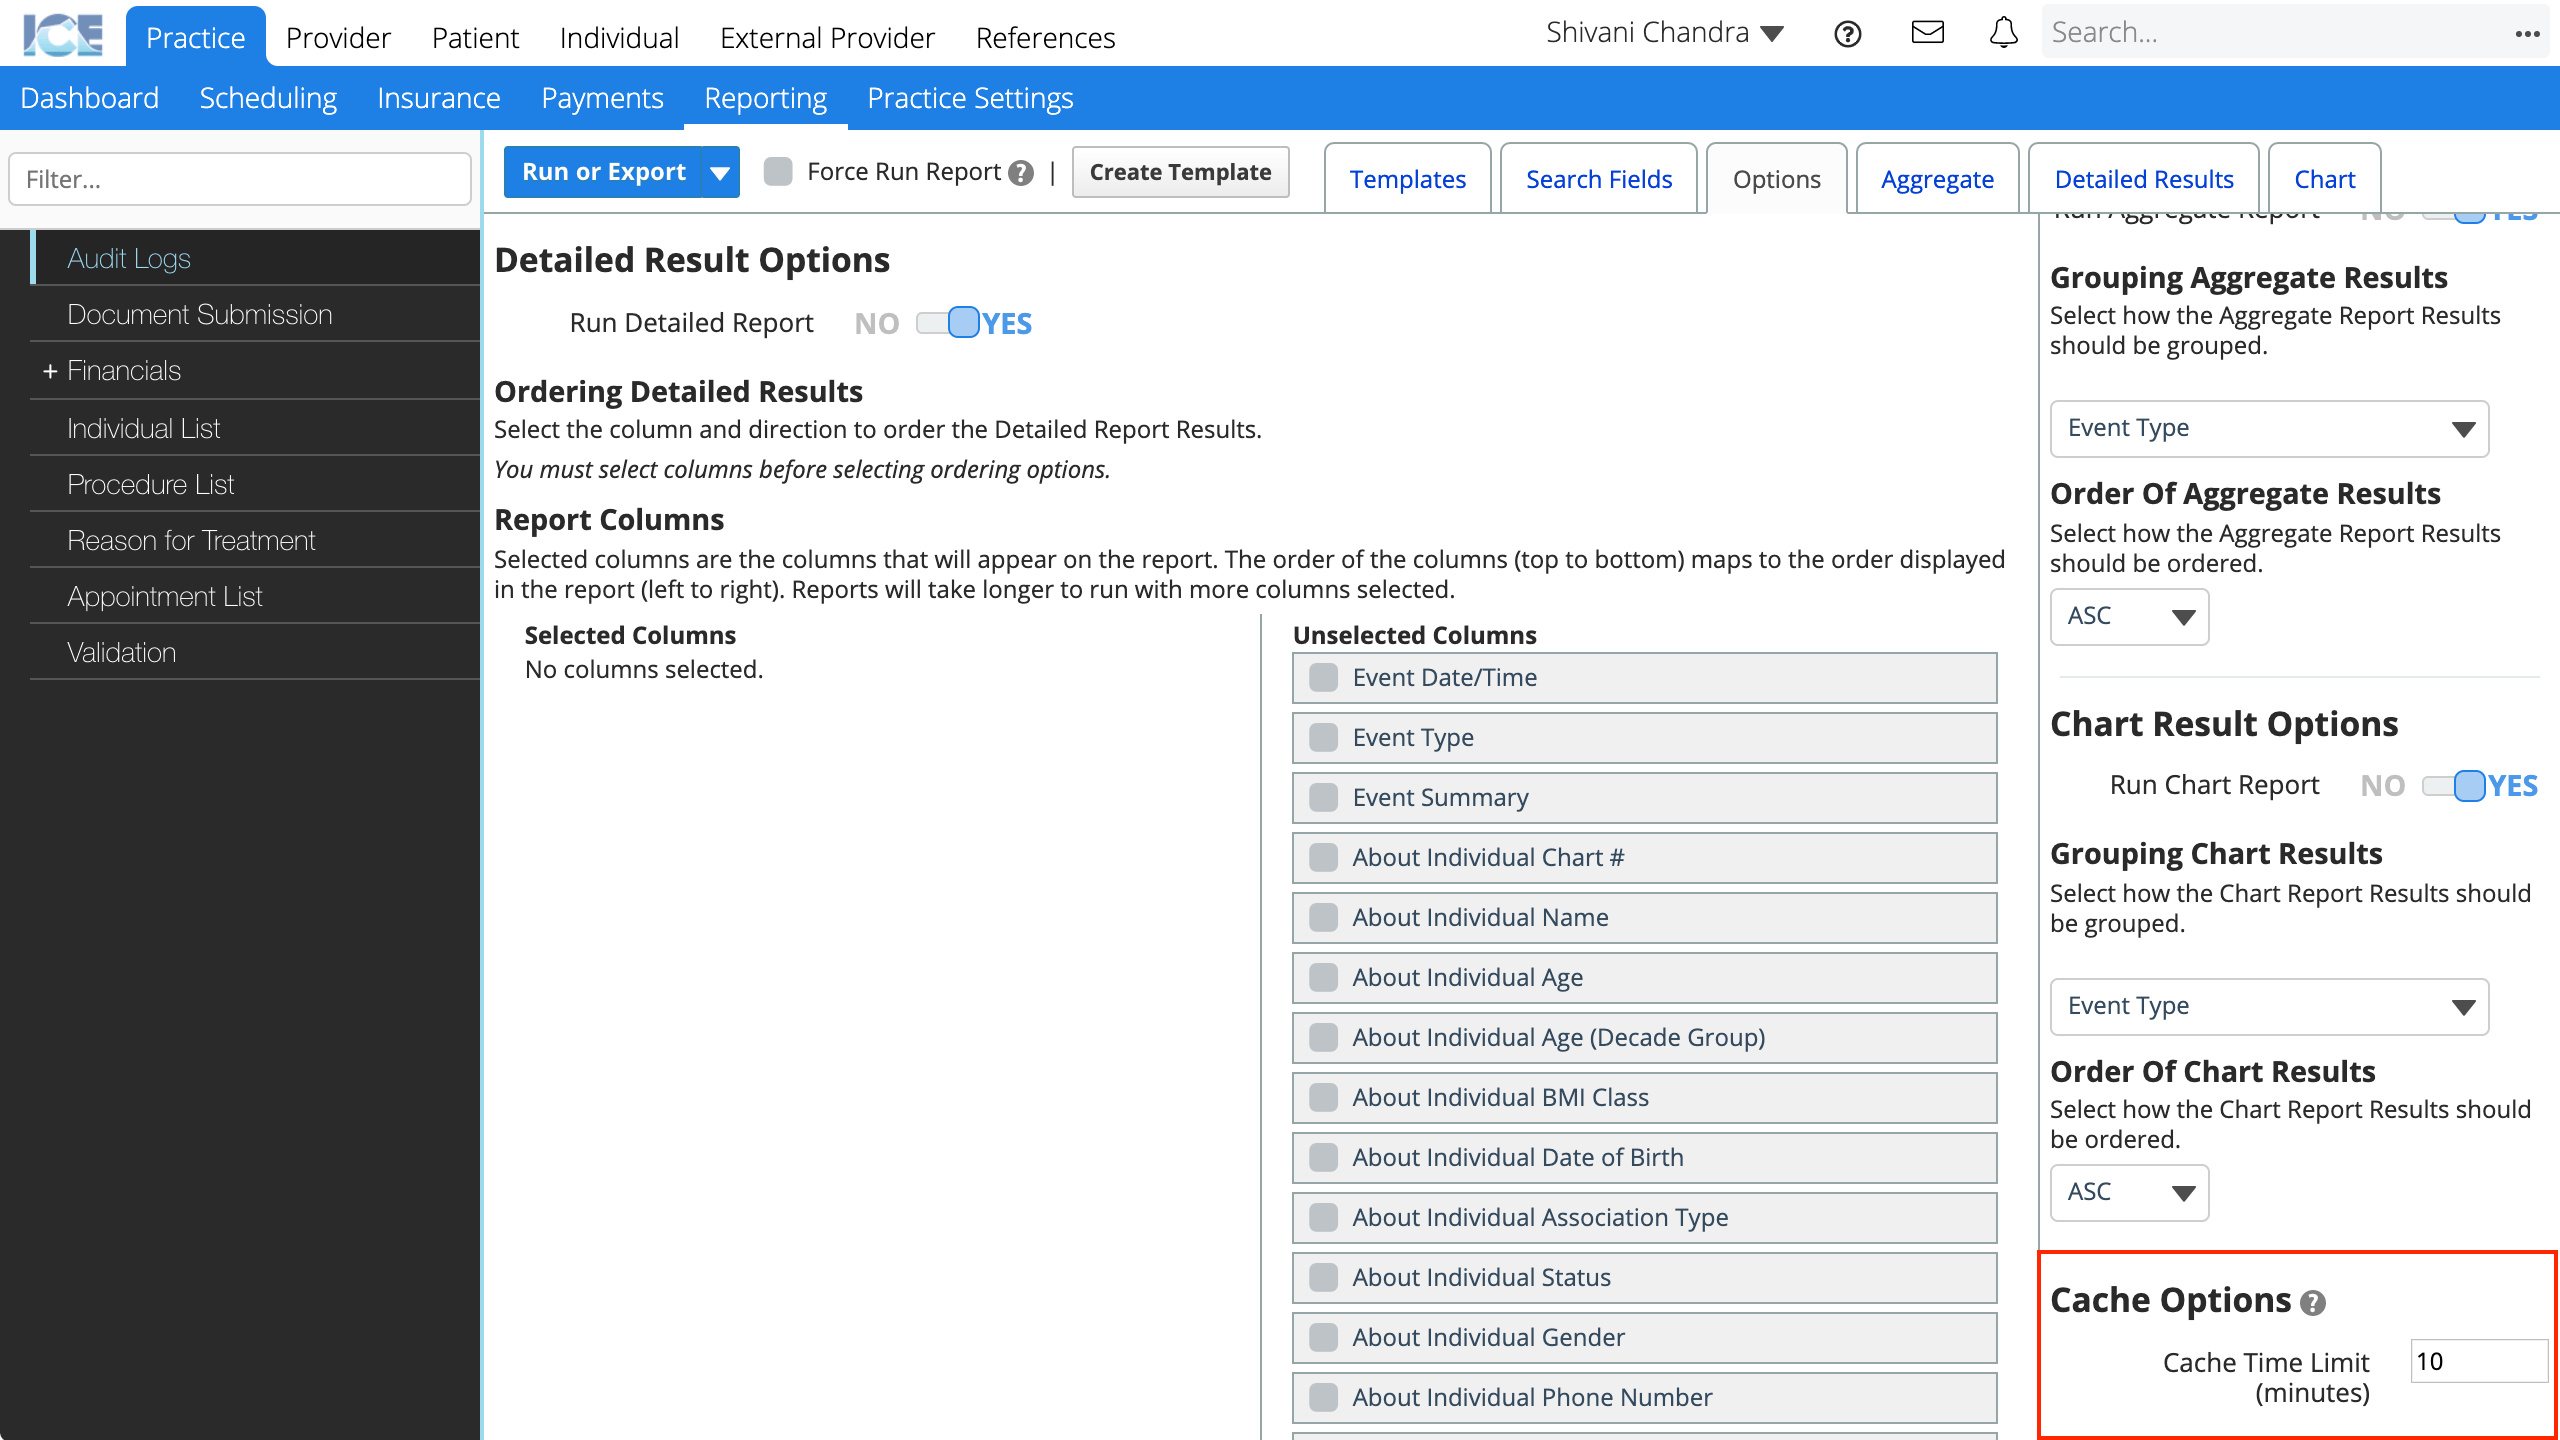
- Update the Cache Time Limit
- The default time limit is 10 minutes.
- It can be set between 1 and 1440 minutes.
- After you make your adjustments you have the following options.
- To run the report with your new settings, select Run or Export
- To create your own copy of a shared report template with these changes, select Duplicate Template
- To update your personal report template with these changes, select Save Template
If you need to ensure that you are running the report based on current data and not using the cached results, be sure to check Force Run Report to the right of Run or Export.