Display report results in a panel
You can display report results on the Practice, Provider, Patient, or Charting dashboards.
A report in a panel runs automatically so you can receive insight into your clinical activity, patient family, or financial progress without manually running reports one at a time.
Each report panel can display a different report template, as a chart view, detailed list, or interactive list, and if the report has multiple data sets you can select tabs along the top to switch data sets.
Add a new report panel
The steps to add a panel are the same for the Practice, Provider, Patient, or Charting dashboards.
- Select
 in the top right corner of the workspace
 - Select + Add beside Reports
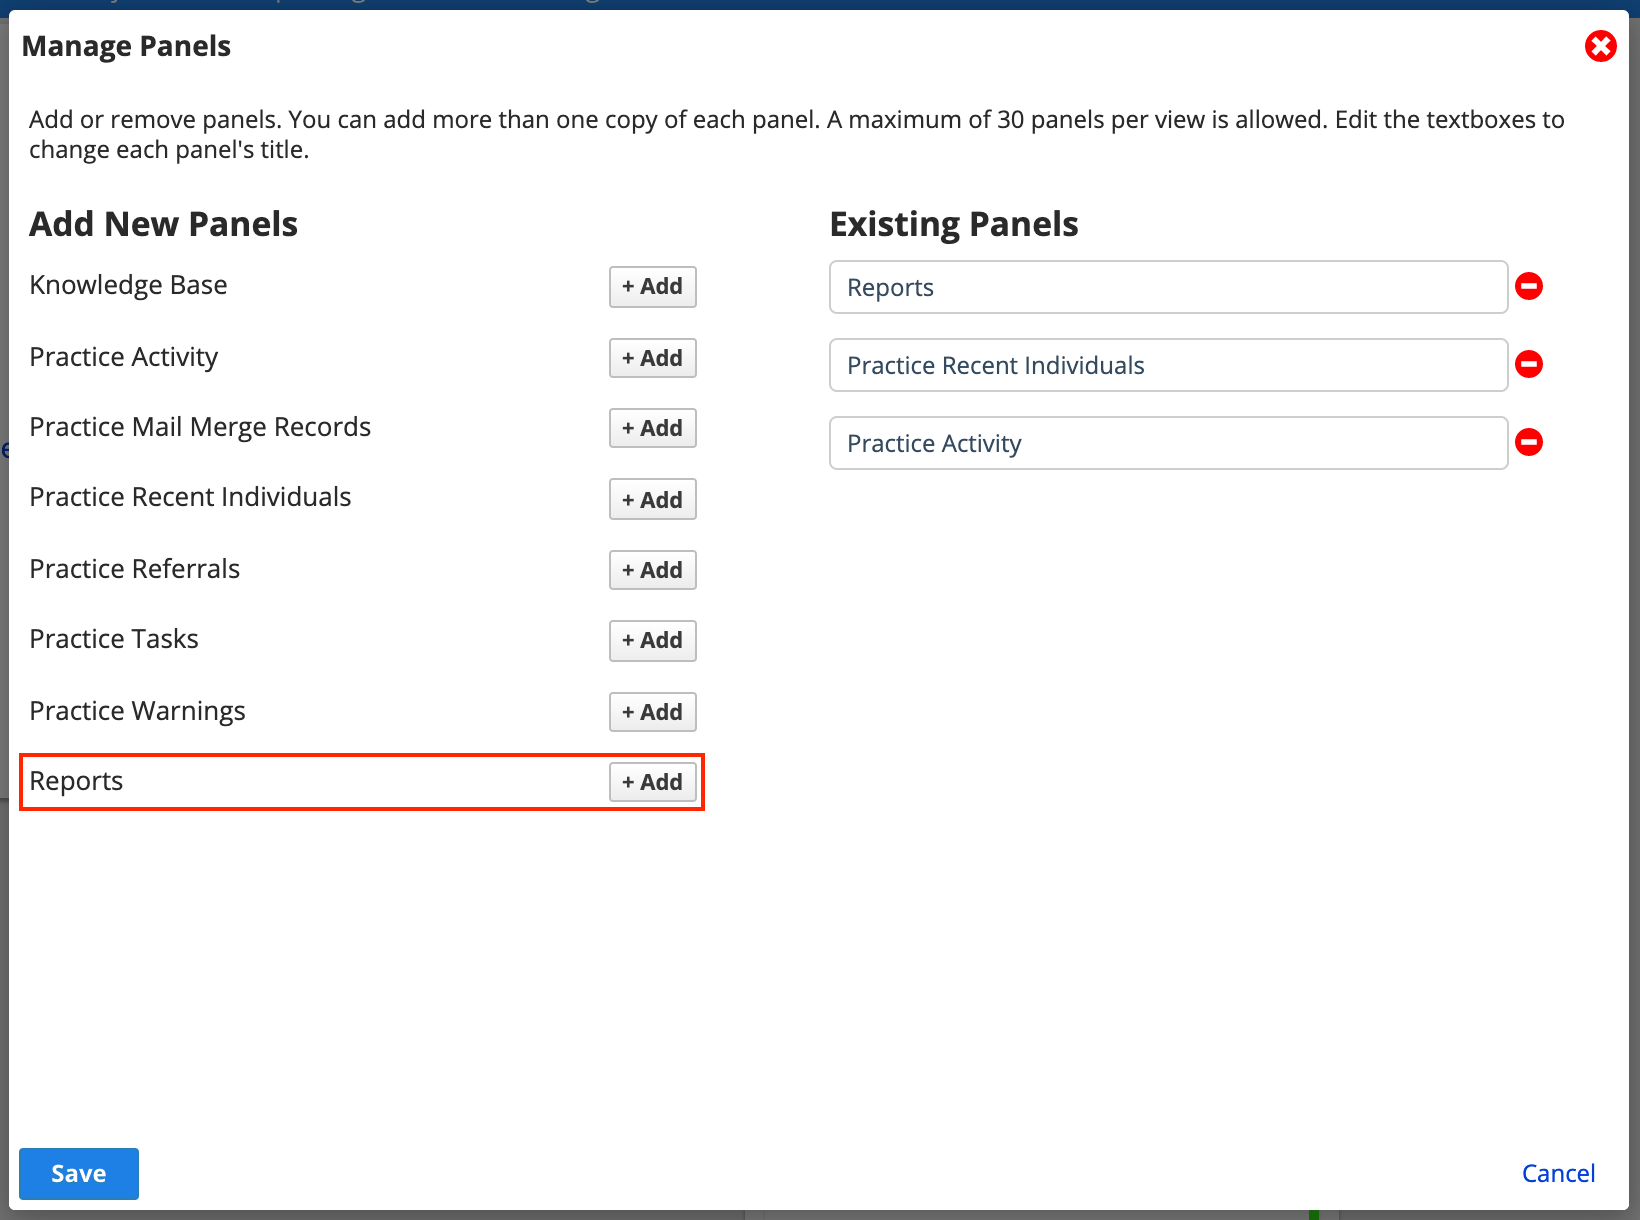
- Select Save
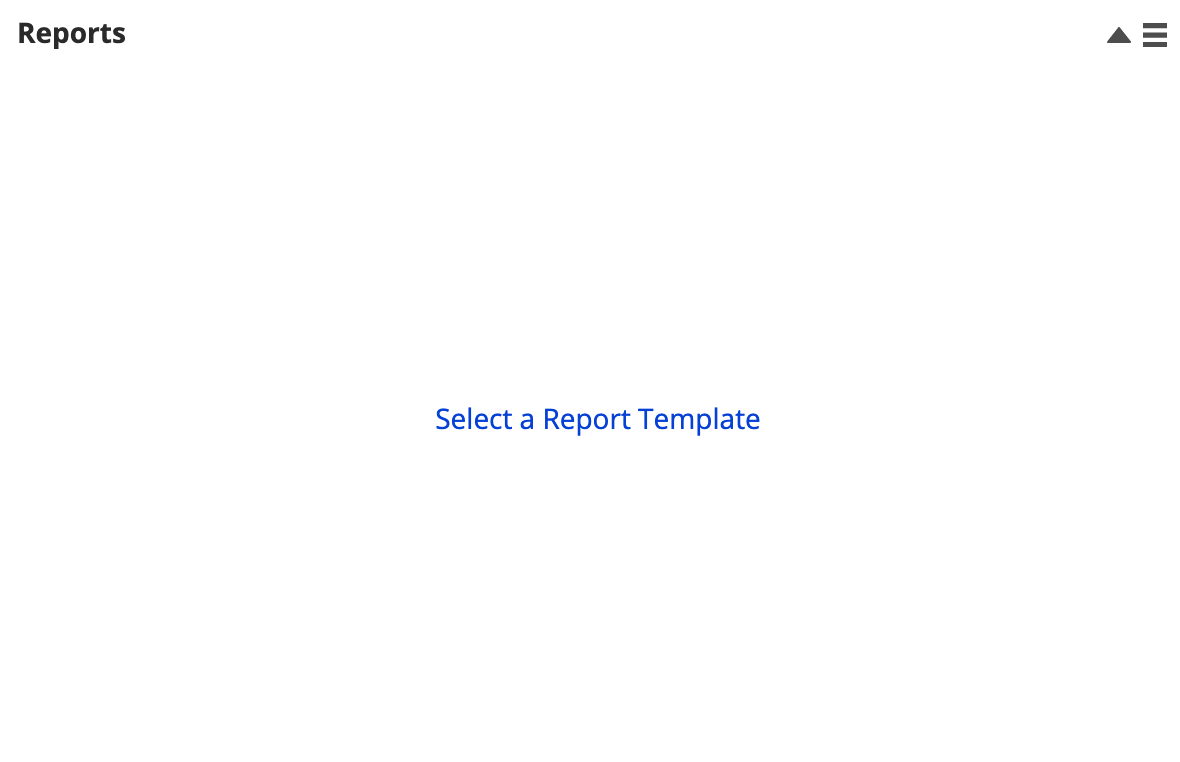
- The report panel is now added to the current panel view.
- From the newly added report panel, choose Select a Report Template
- Choose the type of report you want to display
- Identify the report template you want to use
- The template list will be empty if you do not have any templates for a particular report type.
- Under the report template's name, choose Chart version, Detailed list version or Interactive list version
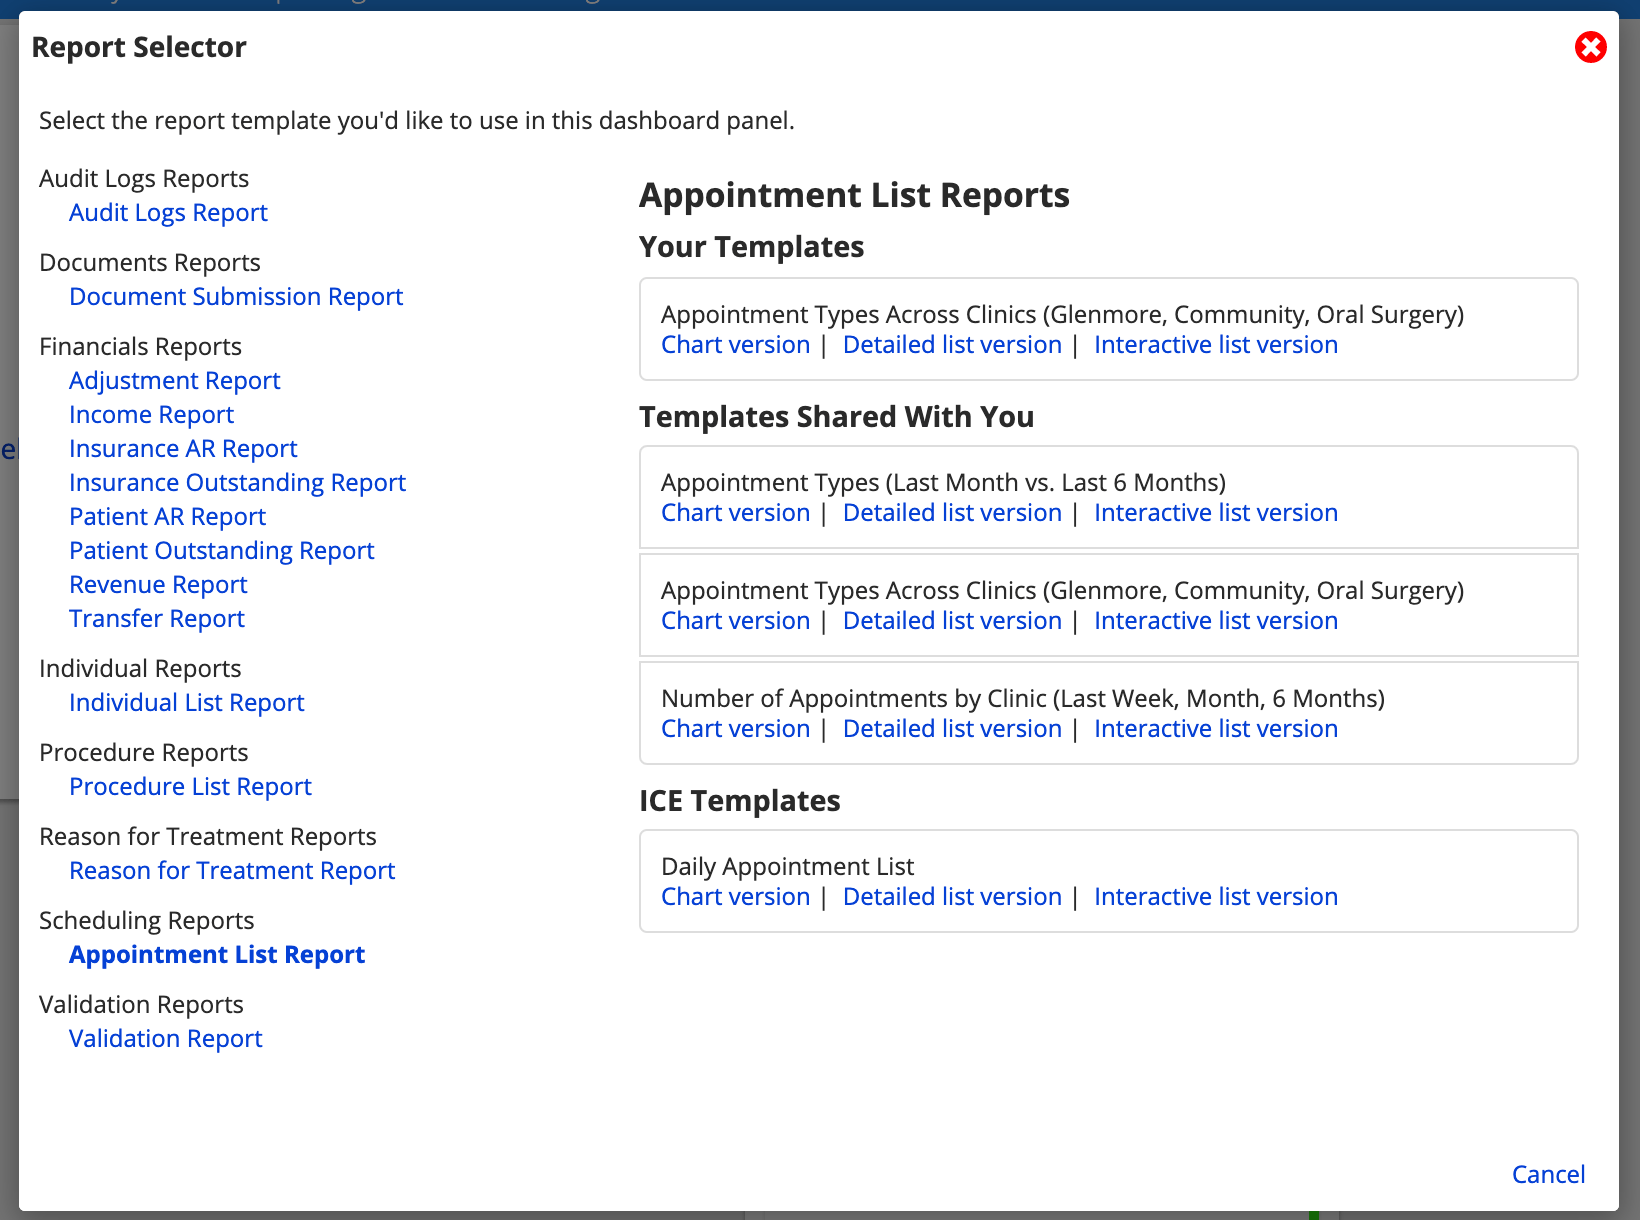
- These options affect how results are displayed and can be changed later.
- Interactive list version is only available for individual, scheduling, and document reports.
- Interactive results can be selected in order to open the individual record, appointment, or document.
- After you choose a version, the report automatically runs and displays results in the panel
Change the look of a report panel
After you setup a report panel you can change how the results are displayed or switch the panel to a different report template.
- Select

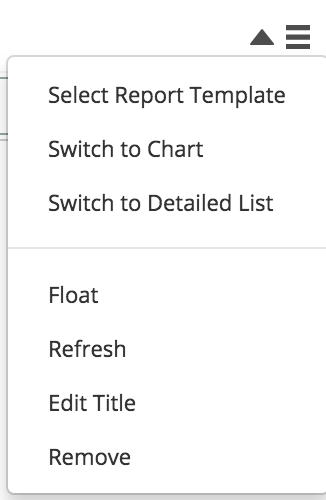
- To use a different report template:
- Choose Select Report Template.
- Follow steps 5 through 7 in the section above.
- To switch between chart, detailed list, or interactive list views:
- Select the relevant Switch to option.
- To change the type of chart displayed:
- Select one of the available chart options e.g., Bar Chart, Pie Chart, Line Chart etc.
Configuration tip: current user
If you configure a report template that you want to appear in a panel, the "Current User" option can save you time.
"Current User" is a Provider search option in a report template. It causes a report to display results specific to the person who is logged in.
For example, you can configure a report to show all appointments scheduled in the next 10 days with the provider "Current User". When people see the results of that report on their screens, they only see their appointments.
This way you don't have to configure copies of a report template for every person that needs to see it, with their name manually entered into each report template copy.